


Top 10 Data Analytics Tools
Top 10 Data Analytics Tools to Learn in 2025 (Excel to Python!)
In today’s data-driven world, the ability to collect, analyze, and visualize data is essential for business success. Whether you’re an aspiring data analyst or a seasoned professional, mastering the right tools can help you uncover insights, automate workflows, and make smarter decisions.
Here are the Top 10 Data Analytics Tools to Learn in 2025, ranging from foundational tools like Excel and SQL to advanced technologies like Python, Spark, and BigQuery.
1. Python
Python continues to rank first among the most popular programming languages for data analytics. It’s open-source, versatile, and used across industries — from data science and AI to web development and automation. What makes Python truly powerful is its vast ecosystem of libraries such as Pandas, NumPy, Matplotlib, and scikit-learn. These tools enable everything from data cleaning and visualization to statistical modeling and machine learning.
Thanks to its simple, readable syntax, Python is beginner-friendly while being powerful enough for large-scale analysis. It’s also easily integrated into Excel and Power BI, bringing automation and advanced analytics to familiar tools. With Python, analysts can move beyond descriptive analysis toward predictive and prescriptive insights. In 2025, Python remains the go-to language for anyone serious about building a long-term data analytics career.
2. R Programming

R remains one of the most powerful languages for statistical computing and data visualization. Though it may not be as universally used as Python, it is a favorite among researchers, academics, and financial analysts. R’s ecosystem — especially the Tidyverse collection — includes tools like dplyr for data manipulation and ggplot2 for elegant data visualization.
R excels in tasks involving hypothesis testing, regression analysis, and forecasting. While it has a steeper learning curve than Python, R provides unmatched capabilities in statistical accuracy and reproducibility. In 2025, R remains essential for analysts who deal with research data, financial modeling, or health informatics, where precision and rigor are key.
3. SQL
SQL (Structured Query Language) is the backbone of data analytics. Almost every dataset resides in a database, and SQL is the universal language used to access, query, and manipulate that data. With SQL, analysts can join multiple tables, filter information, and perform aggregations directly from relational databases such as MySQL, PostgreSQL, and SQLite.
Its straightforward syntax makes SQL one of the easiest tools to learn, yet mastering advanced joins and optimization can take time. Understanding SQL helps analysts ensure data accuracy and improves collaboration with engineers and data scientists. Even as new tools emerge, SQL remains an indispensable foundation for every data professional.
4. Julia
Julia is an emerging programming language designed specifically for scientific computing and high-performance analytics. It combines the speed of C, the simplicity of Python, and the statistical depth of R. Released in 2011, Julia has quickly gained popularity in domains like numerical computing, data mining, and machine learning.
Its standout feature is speed — Julia can handle massive datasets far faster than Python or R in some cases. However, it still has a smaller community and fewer libraries compared to its older competitors. Still, as businesses move toward more computationally intensive analytics, Julia is a rising star worth watching in 2025.
5. Excel
Excel has stood the test of time as one of the most familiar and accessible analytics tools. Despite the rise of modern programming languages, Excel remains widely used for quick data cleaning, visualization, and reporting. Its user-friendly interface, pivot tables, and formula-based flexibility make it a cornerstone for data analysis.
Now, with the integration of Python in Excel, the tool has become even more powerful — blending simplicity with advanced analytical capabilities. Analysts can now automate tasks, create visualizations, and perform statistical operations without leaving Excel. For anyone beginning their analytics journey, mastering Excel remains a non-negotiable skill in 2025.
6. Apache Spark
When traditional tools struggle with massive datasets, Apache Spark steps in. Spark is a cluster-computing framework that allows parallel processing across multiple nodes, making it ideal for big data analytics.
With PySpark, analysts can use Python’s familiar syntax to process millions of records efficiently. Spark supports batch and real-time processing, making it suitable for large-scale data transformation and machine learning tasks. In 2025, as data continues to grow exponentially, learning Spark is essential for analysts working with enterprise-scale or streaming data.
7. Power BI

Microsoft’s Power BI dominates the business intelligence landscape and is often cited as the leading BI platform in Gartner’s Magic Quadrant. Power BI allows analysts to connect data from multiple sources, clean and transform it using Power Query, and create interactive dashboards for business users.
It integrates seamlessly with Excel and supports custom visuals, AI-driven insights, and even Python and R scripts. Power BI’s cloud-based interface allows real-time collaboration and easy sharing of reports across teams. For analysts, it’s a critical tool for turning data into decisions, offering both flexibility and ease of use.
8. Tableau
Tableau is another powerful BI tool designed for advanced data visualization. It enables users to connect, analyze, and visualize data from multiple sources in minutes. Tableau is widely adopted by enterprises for its ability to handle massive datasets and create dynamic dashboards that tell compelling stories.
Compared to Power BI, Tableau offers more customization and deeper visualization capabilities, though it can be more complex for beginners. Its drag-and-drop interface and strong community support make it a top choice for analysts focused on data storytelling and executive-level reporting. In 2025, Tableau continues to be one of the most in-demand visualization tools worldwide.
9. DataLab
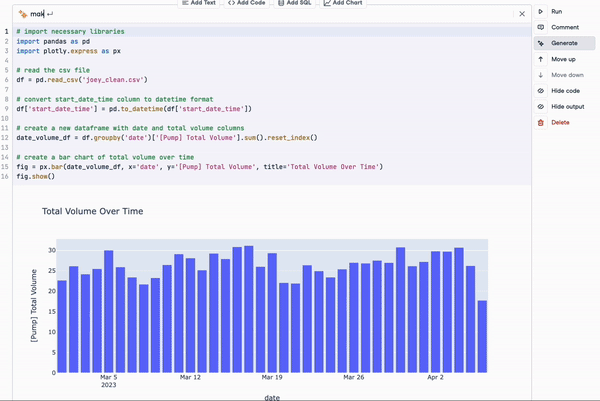
Every data analyst needs a productive workspace, and DataCamp’s DataLab is emerging as an innovative solution. It’s an Integrated Development Environment (IDE) designed specifically for data analytics, offering built-in tools for writing, debugging, and visualizing code.
What makes DataLab unique is its AI Assistant, which helps users fix code errors, generate code from natural language queries, and receive intelligent suggestions. It combines learning and execution in one place, making it ideal for both beginners and professionals. As organizations emphasize collaboration and efficiency, tools like DataLab will shape the future of accessible analytics.
10. Google BigQuery
Google BigQuery is a fully managed, serverless data warehouse that enables lightning-fast querying of large datasets. It’s part of the Google Cloud Platform and eliminates the need for managing infrastructure — you simply upload data and query it using SQL.
BigQuery is ideal for organizations handling terabytes of data that need quick, scalable analysis. It integrates with BI tools like Looker, Tableau, and Power BI, allowing analysts to visualize results instantly. However, analysts must manage queries efficiently to optimize costs. In 2025, BigQuery stands as a critical tool for cloud-based analytics and large-scale data processing.
Conclusion
At Learnomate Technologies, we don’t just teach tools—we train you with real-world, hands-on knowledge that sticks. Our Data Analyst training program is designed to help you crack job interviews, build impactful projects, and grow confidently in your data-driven career.
Want to see how we teach? Hop over to our YouTube channel for bite-sized tutorials, student success stories, and data analysis techniques explained in simple English.
Ready to get certified and hired? Check out our Data Analyst course page for full curriculum details, placement assistance, and batch schedules.
Curious about who’s behind the scenes? I’m Ankush Thavali, founder of Learnomate and your guide for all things data, analytics, and visualization. Let’s connect on LinkedIn—I regularly share practical insights, job alerts, and learning tips to keep you ahead of the curve.
And hey, if this article got your curiosity going…
👉 Explore more on our blog, where we simplify complex topics like SQL, Python, Power BI, Excel, and advanced analytics.
 Want to see how we teach? Head over to our YouTube channel for insights, tutorials, and tech breakdowns:
  www.youtube.com/@learnomate
 To know more about our courses, offerings, and team: Visit our official website: www.learnomate.org
 Let’s connect and talk tech! Follow me on LinkedIn for more updates, thoughts, and learning resources: https://www.linkedin.com/in/ankushthavali/
 If you want to read more about different technologies, Check out our detailed blog posts here: https://learnomate.org/blogs/
Let’s keep learning, exploring, and growing together. Because staying curious is the first step to staying ahead.
Thanks for reading! Now it’s time to turn this knowledge into action. Happy learning, and see you in class or in the next blog!
Happy Analyzing!
ANKUSH
