icon Join the 3-Day Free Live Sessions on Data Science with Gen AI ENROLL NOW

explain Plan

Breadcrumb Abstract Shape
  • 12 Dec, 2021
  • 0 Comments
  • 1 Min Read

explain Plan

Oracle Explain Plan - Performance Tuning


1. Creating a Plan Table

The first thing you will need to do is make sure you have a table called PLAN_TABLE available in your schema. The following script will create it for you if you don’t already have it:

export ORACLE_SID=PrimeDG

sqlplus / as sysdba

@?/rdbms/admin/utlxplan.sql


2. Explain Plan Syntax:


EXPLAIN PLAN FOR your-sql-statement;


For example:

explain plan for

Select empno, ename, sal from emp where empno=9999;


OR if you have the statement_id, then you can use that as well.


EXPLAIN PLAN SET STATEMENT_ID = statement_id FOR your-sql-statement;


3. Formatting the output

After running EXPLAIN PLAN, Oracle populates the PLAN_TABLE table with data that needs to be formatted to presented to the user in a more readable format. Several scripts exist for this, however, one of the easiest methods available is to cast dbms_xplan.display to a table and select from it (see examples below).


Some Examples

SQL> EXPLAIN PLAN FOR select * from dept where deptno = 40;

Explained.

SQL> set linesize 132

SQL> SELECT * FROM TABLE(dbms_xplan.display);

or

SQL> @?/rdbms/admin/utlxpls.sql


PLAN_TABLE_OUTPUT

—————————————————————————————

Plan hash value: 2852011669

—————————————————————————————

| Id  | Operation               | Name | Rows  | Bytes | Cost (%CPU)| Time |

—————————————————————————————

|   0 | SELECT STATEMENT        |     | 1 | 20 | 1   (0)| 00:00:01 |

|   1 |  TABLE ACCESS BY INDEX ROWID | DEPT | 1 | 20 | 1   (0)| 00:00:01 |

|*  2 |   INDEX UNIQUE SCAN     | PK_DEPT | 1 |   | 0   (0)| 00:00:01 |

—————————————————————————————


Predicate Information (identified by operation id):

—————————————————


   2 – access(“DEPTNO”=40)


14 rows selected.


4. Using SQL*Plus Autotrace

SQL*Plus also offers an AUTOTACE facility that will display the query plan and execution statistics as each query executes. 

For Example: 

SQL> SET AUTOTRACE ON


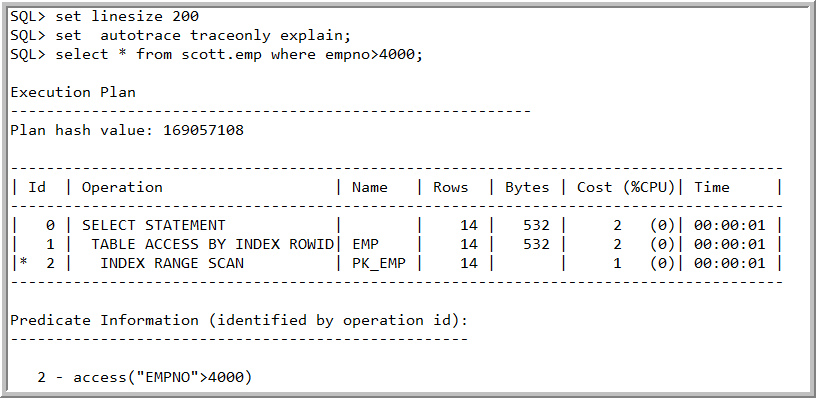
5. FOR only explain information from autotrace, use:

SQL> set linesize 200

SQL> set  autotrace traceonly explain;


6. For query output and explain information from autotrace, use:

For example:

SQL> set autotrace on explain

SQL> select count(*) from At_Common.oms_order_item where trim(size_name)=’0.5′ and site_id = 611;


  COUNT(*)

———-

      0


Elapsed: 00:00:16.98


Execution Plan

———————————————————-

Plan hash value: 1101236086


————————————————————————————-

| Id  | Operation      | Name       | Rows  | Bytes | Cost (%CPU)| Time |

————————————————————————————-

|   0 | SELECT STATEMENT   |            | 1 | 9 | 50243   (4) | 00:10:03 |

|   1 |  SORT AGGREGATE |            | 1 | 9 |        |      |

|*  2 |   TABLE ACCESS FULL| OMS_ORDER_ITEM |47138 | 414K| 50243   (4) | 00:10:03 |

————————————————————————————-


Predicate Information (identified by operation id):

—————————————————


   2 – filter(“SITE_ID”=611 AND TRIM(“SIZE_NAME”)=’0.5′)


lets talk - learnomate helpdesk

Let's Talk

Find your desired career path with us!

lets talk - learnomate helpdesk

Let's Talk

Find your desired career path with us!